|
Power Analysis using StudySize 3.0. Non-inferiority for
proportions A clinical trial is planned to compare the effect of a new treatment with the existing treatment. The plan is to show that the new treatment is clinically at least as good as the existing. Since the new treatment is thought to have fewer adverse events, it is considered sufficient to show that the true percentage of patients responding to the new treatment is not less than 5% compared to the old one. From previous experience one knows that the percentage of responders with the existing treatment is approximately 60%. The study will be a randomized double blind parallel group study with equal number of patients in the two groups. The objective is to conclude that the true percentage of responders with the new treatment is at most 5% less than for the existing. Thus the difference in percentage of responders, the new treatment minus the existing treatment, should be greater than - 5%. If this is the case, the new treatment is considered as non-inferior to the existing treatment with respect to the percentage of responders. The intention is to perform a one-sided test based on the binomial distribution and conclude that the new treatment is non-inferior if the calculated one-sided p-value is less than 0.05 (significance level), i.e. a statistical significant result. Moreover, if the true difference between the new treatment and the old treatment is exactly 0%, then the test should give a p-value less than 0.05 with a probability of 0.80. In other words, we should conclude non-inferiority with a probability of 0.80 (power). Since we want to conclude that the difference in responders, new treatment minus existing treatment, is greater than - 5%, we choose as the null hypothesis H0: the true difference in proportions is less than or equal to - 0.05 and the alternative hypothesis H1: the true difference in proportions is greater than - 0.05. The null hypothesis is rejected if the calculated difference in proportions is large enough.
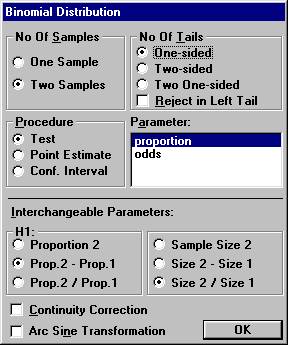
Open the File menu and choose New Calculation. Choose
the option button One-sided, and among the Interchangeable Parameters
options Prop. 2 - Prop. 1 and Size 2 / Size 1, and click OK.
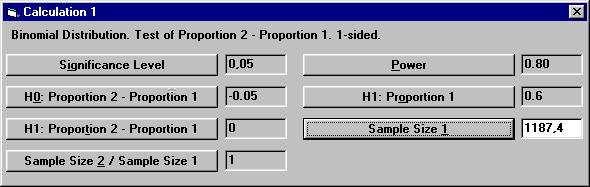
Set the following parameter values except for Sample Size
1 and then click the Sample Size 1 button. From
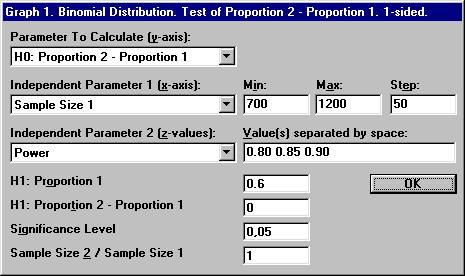
the File menu choose New Graph. The
previous options for the binomial distribution will show up. Set the parameter values shown below and click OK
This
will create a graph where the difference in proportions under H0 is
calculated for a range of values for Sample Size 1 and for three distinct
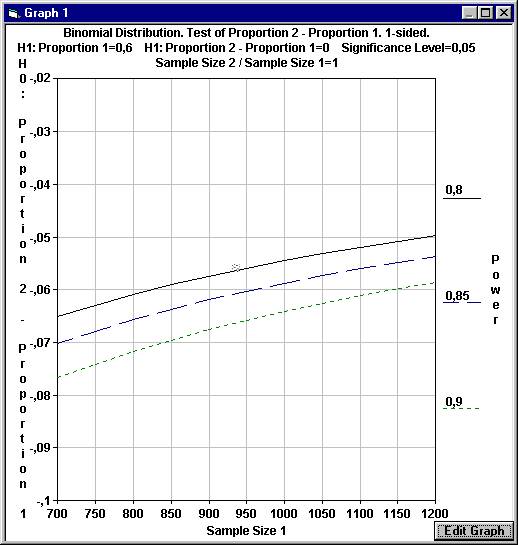
values of the power. As can be seen with 1200 patients in each group and a power
of 0.80 the difference under H0 will be slightly less than - 0.05, as
compared to the calculations above with 1188 patients in each group.
If we can only use 700 patients in each group but want a power of 0.85,
we have to set the level of non-inferiority to - 0.07 instead of - 0.05 |